For ABA clinics wondering how ABA Engine might be helpful to their clinic, we’ve put together a breakdown of the visual dashboards you’ll see as a user.
The system we’ve designed is aimed at helping you get a comprehensive look at what’s happening in your clinic now. You can also track your clinic’s history and look ahead at what’s to come.
Operational inefficiencies in the U.S. healthcare system cost between $700 billion and $750 billion each year. That translates to a lot of money for each individual clinic. And ABA therapy is an area of healthcare that needs to be able to focus all its time and budget on client care. Kids often sit on waiting lists for weeks or months while their paperwork is processed. Meanwhile, they’re without care, and the families feel at a loss.
To help resolve this issue, get clients into their clinics more quickly, and match clients to the right therapist, ABA Engine designed the visual dashboards on our platform.
These dashboards help clinic staff take an overarching view of the entire clinic from both a big picture and a snapshot perspective. You can review a single client or an entire state of clients.
This visualization helps clinics both understand what is happening in the clinics and move clients and employees through their individual processes. You’ll run a quicker, more efficient, more client-friendly clinic with these tools.
The visual dashboards are broken down into four sections:
The client hours dashboard allows you to view how you’ve scheduled your clients and what your total client hours are. You can filter this dashboard in many ways:
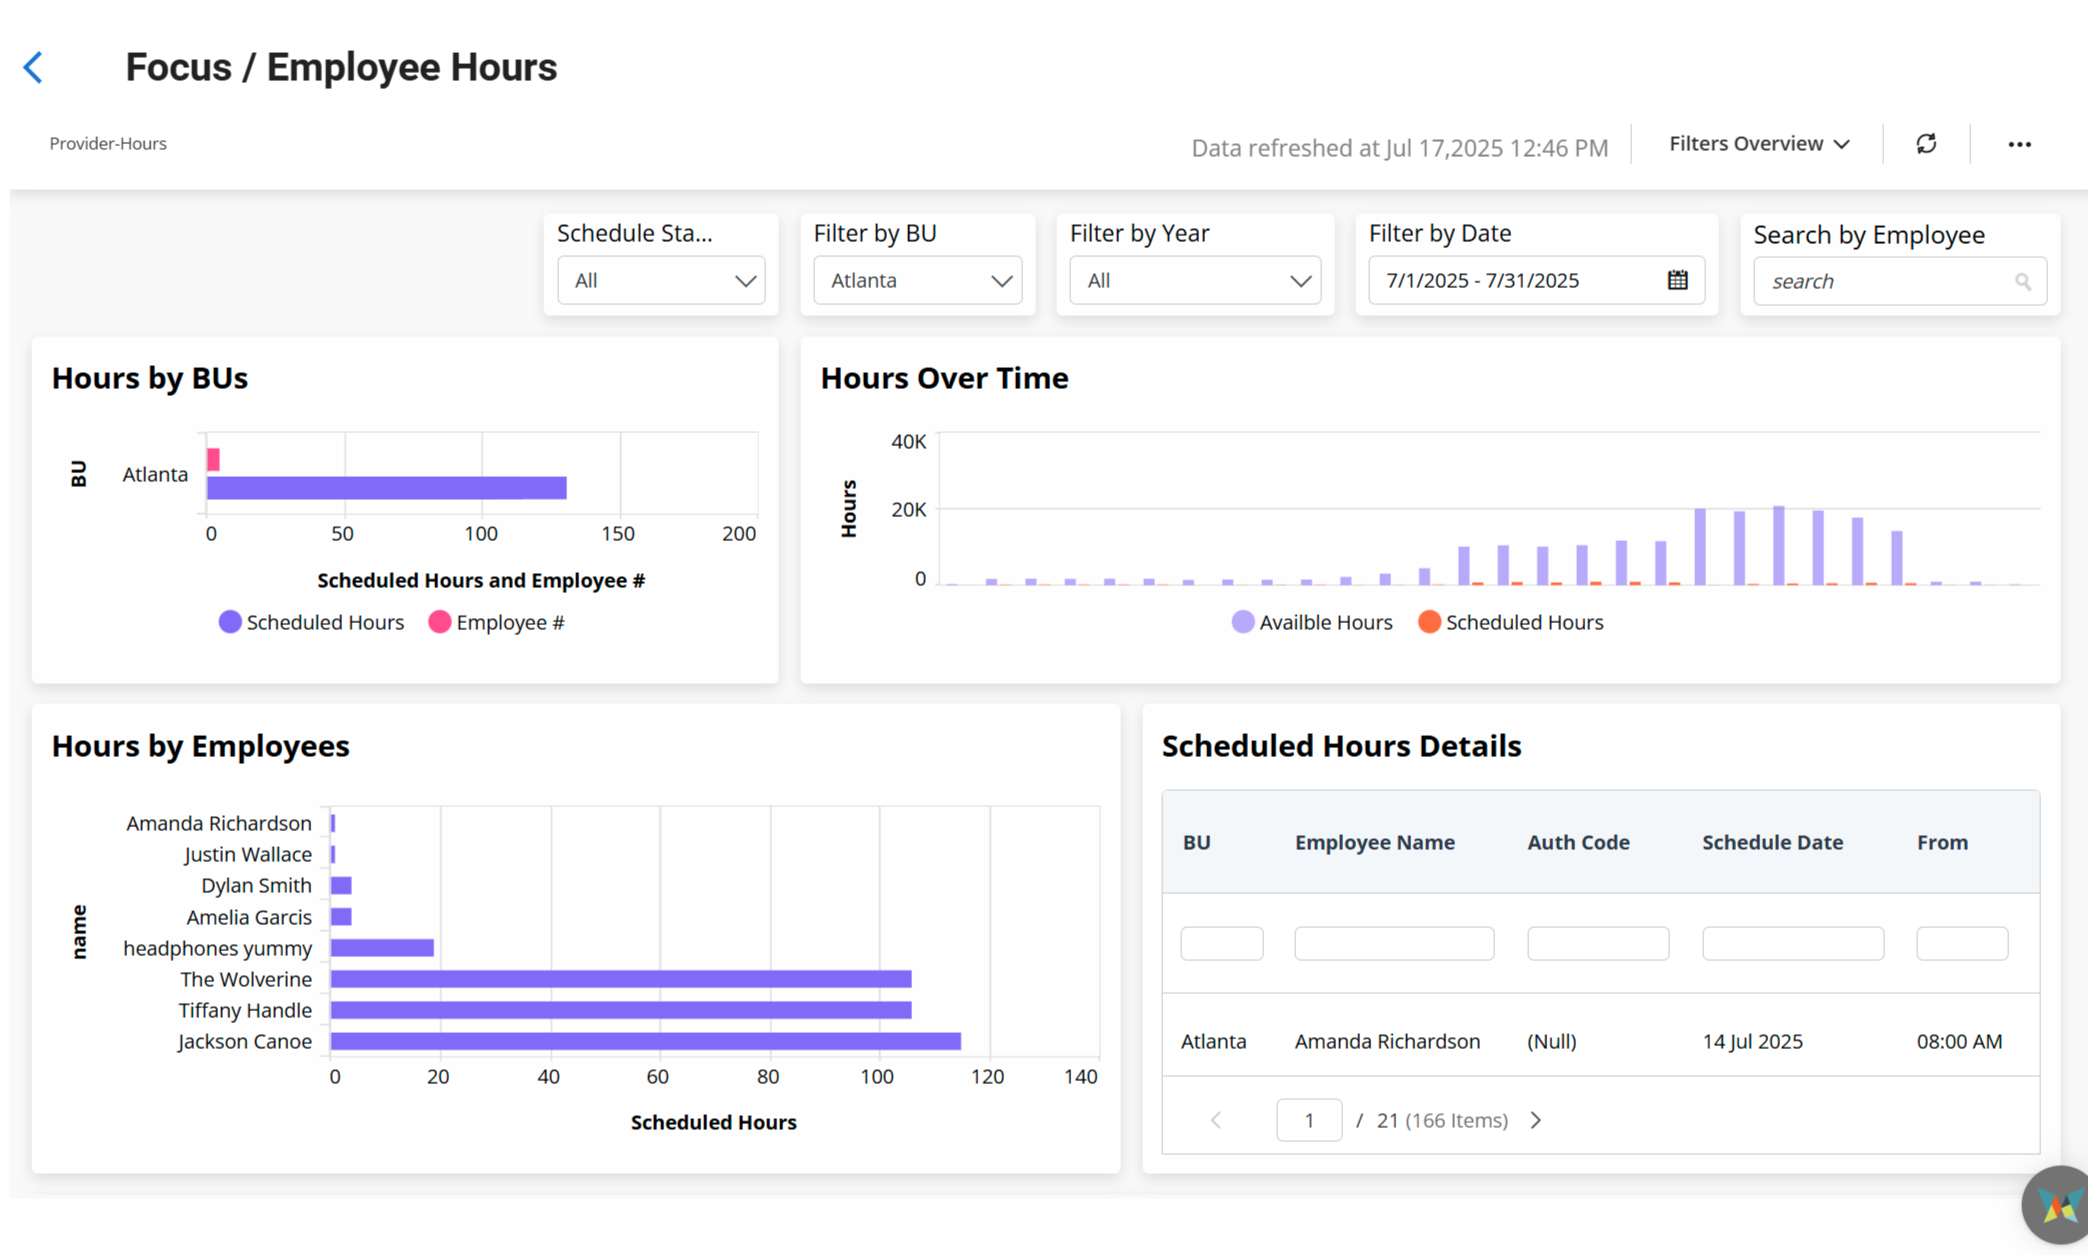
This dashboard gives you insight into your employee’s scheduled hours compared to their availability.
Viewing this dashboard can help you figure out how to build more clientele into a specific employee’s schedule, or understand why one employee may be working vastly more hours than another.
As with client hours, you can filter according to clinics, regions, states, and dates for a specific employee, etc.
The intake dashboard will allow you to see the intake process for each client. With this broad view, you can set goals and then measure the actual experience against the goals.
You’ll be able to see how many days it takes for each client to come into services, broken down by each stage.
This dashboard offers a pie graph that reveals how many kids you have in each step of the intake process.
You’ll also see the checklist for each client, with notes and a timeline of how they stayed in each stage.
Like with the intake process, the onboarding dashboard will allow you to look at how long it takes to onboard a new employee.
Clinics can set up their own step-by-step process and set goals for onboarding and then check off each stage as the employee passes through it.
For example, you can set a goal of 10 days for credentialing and then track your employee as they move through that phase, staying on top of the process to be sure they hit that goal.
You can also pull any of the data from your dashboards and export it into a file that can be shared with your clients, with therapists, or as part of a team meeting to discuss room for improvement.
For example, if you filter a single business unit for a month, and you find that you had 8,000 available hours and you only schedule 200, you can start brainstorming ways to bring in more clients, outreach potential, and opportunities for growth.
In the end, the visual dashboards on ABA Engine allow clinics to keep all of their data on a single platform and get a high-level visual representation of every process in the clinic.
You can view your client hours and approvals, employee hours and availability, the client intake process, and the employee onboarding process. You can customize each dashboard with your own steps, procedures, requirements, and documents. Set goals and check off your checklist.
The goal is to help you run a highly efficient and effective ABA clinic for staff peace of mind and client satisfaction.
We help you hit that goal.
Book a demo with ABA Engine today!
Ready to improve your clinic’s data analysis and see the whole picture? ABA Engine is here to help!
ABA Engine’s visual dashboards provide a high-level, easy-to-understand overview of your clinic's operations. They allow you to monitor and analyze four key areas: client hours, employee hours, client intake, and employee onboarding. These tools help you streamline workflows, identify bottlenecks, and make data-driven decisions to improve overall efficiency.
Yes! Each dashboard is fully customizable. You can define your own steps, procedures, timelines, and documentation requirements for both the intake and onboarding processes. This flexibility ensures the system aligns with your clinic’s unique workflows and compliance needs.
By visualizing progress and identifying delays in real time, the dashboards help reduce wait times for clients and accelerate onboarding for new staff. This leads to faster service delivery, more balanced caseloads, and a smoother experience for both families and team members.
Absolutely. All dashboard data can be exported into shareable files, making it easy to present insights during staff meetings, strategic planning sessions, or even when communicating with clients. This feature supports transparency, accountability, and continuous improvement.